Toronto, Elastic{ON} Tour 2017

Been using Elasticsearch a lot lately: it empowered our existing logs to provide the team with near-realtime monitoring thanks to Kibana, and some ease of mind with convenient alerting and custom PagerDuty integration, because nobody really wants to look at dashboards all day long. With the SixT4.io team working at Brookfield Place, we couldn’t miss the Elastic{ON} Tour 2017 across the street at the Sony Centre for the Performing Arts. So our DevOps Corey and I went to see where we are at, discover what we could learn, and get inspired by people from Elastic, the company with their demos and advices.
Machine learning
Definitely one of the topic that caught our attention while we registered. We came full of questions and high on expectations:
- what if machine learning on the Elastic stack could help us detect new types of issues at the very moment they happen? Configuring alerts is good, but it’s next to impossible to cover all of the cases that will ever happen, and each of those awkward scenarios where you should or shouldn’t be alerted.
- how about anticipating seasonality, which we constantly have to deal with in the travel industry? Think about vacations, public holidays: from one day to another, we can see 2 to 5+ times more traffic on our systems.
We were actually quite surprised by the work that had been done, and showcased in front of us by Sophie Chang, Team Lead Machine Learning at Elastic. They approached machine learning this way: modeling the behaviour of time series data (one of Elasticsearch strength) as a baseline for anomaly detection. Probably not as easy as it sounds, but building statistical models upon data is something pretty common nowadays. And once done, detecting data that do not match the model sounds nearly boring. But do that with a few clicks in Kibana on real-life data (coming from a webserver in this example), and that looks like science fiction:
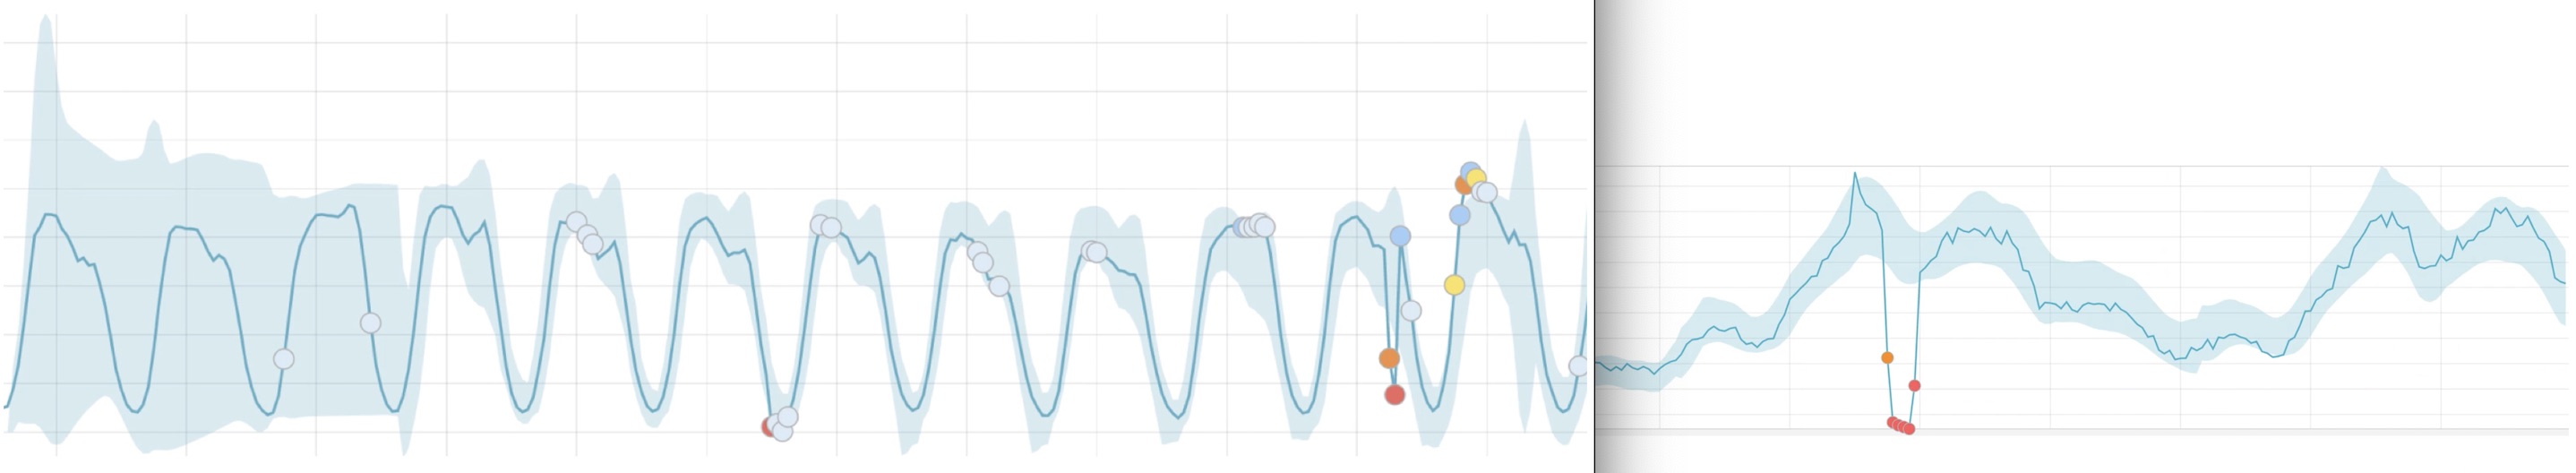
After just a few iterations (3 days in this example), the behaviour of the selected data (visitors on a website) is modeled with an impressive accuracy, and anomalies in the expected pattern are pin-pointed automatically. What more? This applies to your near-realtime data at any given time, so you could receive alerts from scenarios you couldn’t even think of or anticipate!
Amazing. But that was just the beginning. With enough data, usually 2 “periods of time” like 2 full weeks including 2 weekends, you can confidently benefit from another feature that’s been implemented: forecasting. The statistical model built for anomaly detection is conveniently re-used to generate what the future behaviour of your data is expected to look like, expanded over time to reflect the confidence level:
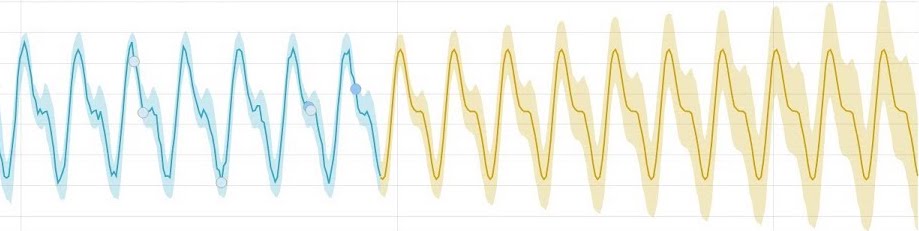
Now, welcome to the future! Learn more on the Elastic Stack Machine Learning feature/product page.
Interesting case study
Another refreshing talk was from Jeremy Foran, Technology Specialist with BAI Canada. Perfect match with the audience as BAI Canada is working with the TTC - Toronto Transit Commission, the agency responsible for the transit system here in Toronto - on deploying Wi-Fi inside the subway. We were given some insights into how they are building and scaling their captive portal and WiFi network to make sure that about 80k users an hour get their smartphone connected, preferably hundreds at the same time (when the subway arrives at the station and users leave the train) and within very short 1 to 2 minutes periods of time before they hop on their next ride or get out the station.
Then we were described how they used Elasticsearch, Logstash and Kibana to ingest raw data that was initially hard to query, and achieve efficient reporting and monitoring. That provided their teams with the ability to answer both sales and technical questions easily, by just browsing data and dashboards. Pretty interesting to us as it was more or less the path we followed to get near-realtime insights into our infrastructure and overall operations directly from our logs.
Even better part was about moving to the next level with alerting and smarter data usage. Configuring alerts was simple to them but quickly became ineficient as they weren’t able to spot all potential problems, and eventually came with dozens of alerts that weren’t even looked at anymore, because just considered to be noise. That is where machine learning and anomaly detection mechanisms described above obviously helped them: getting better alerts when real problems happens, and being able to drill down to find the reasons.
Moving forward, they are now re-thinking their data as a base for smarter scenarios, something like selling premium digital advertising when more users are waiting around for whatever reason (delays, capacity or special event). This is typically where companies start multiplying the return on investment made for their infrastructure in general and logging platform in particular, which quickly allows them to extract more value from the same data, and come with smarter, innovative products that might totaly disrupt their market.
Takeaways
Along the day with the talks, demos and “ask me anything” booths, I couldn’t help but thinking about how minimal our usage of the various Elastic tools was: not even mentioning machine learning, we aren’t using Elasticsearch for anything else but our logging based monitoring platform. Though, one of our products and use case would incredibly fit Elasticsearch strength at scale with millions of documents and the power of aggregations.
Immediately after the conference, I got back to the office and had a chat with some teammates about the opportunity that was waiting for us there, and it appears that with some tests and architectural discussions, a consensus was quickly reached about the benefits from integrating part of our software with an Elasticsearch backend and some advanced queries to build and serve even better content while allowing us to scale better in the future… Definitely an inspiring day!
Want to know what we built from here? Need a hand with your logging based monitoring platform, building dashboards, near-realtime alerting, or integrating Elasticsearch within your application?
I would love to get your feedback! Get in touch right now by email.
- Elastic, the company: https://www.elastic.co/
- Elasticsearch: https://www.elastic.co/products/elasticsearch
- Machine Learning feature/product page: https://www.elastic.co/products/stack/machine-learning
- Kibana: https://www.elastic.co/products/kibana
- Logstash: https://www.elastic.co/products/logstash